● GAMBIT OPTIONS DESK · GEX / PRINTS
Dealer gamma exposure: where hedging may dampen or amplify a move
An option a dealer holds is typically hedged in the underlying, and the size of that hedge changes as price moves. Aggregate it across strikes and you have gamma exposure: an estimate of where hedging pressure may lean against a move and where it may add to one. Gambit computes it per ticker, by strike and by expiry, with the regime, the gamma flip, the call wall and the put wall beside the option print tape. Key g.
AS OF 10 AUGUST 2026 · SOURCE: GAMBIT · FIGURES BELOW ARE FROM A 10 AUGUST 2026 CAPTURE, NOT LIVE · CURRENT VALUES IN THE TERMINAL ↗
How to read it
What this tells you, and what it does not
What this tells you
Whether dealer hedging is currently more likely to lean against a move or to reinforce it, and the strikes where that behaviour may change character.
What it does not tell you
It does not predict direction, and it is an estimate rather than a disclosure. It rests on open interest, on option pricing inputs and on an assumption about which side dealers hold. The profile also moves as spot travels, as contracts trade and as expiry approaches.
What to inspect next
Check the newsfeed for a catalyst, earnings for known event risk on the date, alerts to watch the flip or a wall, and rebalance flow for a second mechanical force arriving into the same close.
First principles
What gamma exposure actually measures
When you buy an option, someone sells it to you, and that someone is usually a market maker who has no view on the stock. To stay flat, the dealer hedges the option's delta in the underlying. But delta is not fixed: as spot moves, the option's delta moves too. Gamma is the rate at which delta changes, and therefore the rate at which the dealer has to keep re-trading the underlying just to stay hedged.
Gamma exposure, or GEX, aggregates that obligation. For every strike and every expiry, take the open interest, take the contract's gamma, scale it by the contract multiplier and by spot, and sign it by the side of the trade dealers are assumed to be holding. Sum the lot and you have a single number. Gambit reports it as signed dollar gamma per 1% move in the underlying, a positive figure meaning the complex is modelled as long gamma. It is an estimate built on public open interest and an assumption about which side dealers hold, not a disclosure of anyone's book.
That number is not a forecast of direction. It is a statement about mechanics: about who is obliged to trade, in which direction, when price moves. Which is why it so often explains a session that otherwise looks like it had no reason.
What updates, and what does not
The profile moves intraday. The open interest behind it does not.
Modelled gamma changes through the session because spot moves, option prices move and time to expiry shortens. The open-interest input does not move with it. Official open interest is reconciled and published daily, so an intraday profile is built on the latest published figures rather than on contracts as they trade. Gambit labels the source and its delay on the desk.
That matters most on a heavy 0DTE day, when the positioning being opened and closed during the session is exactly the positioning the published figure has not caught up with yet.
The two regimes
Positive gamma may dampen. Negative gamma may amplify.
The sign of modelled aggregate gamma is what decides which way hedging leans, if the model's assumptions hold. Under them, long dealer gamma implies countercyclical hedging and short dealer gamma procyclical hedging. Dealers need not hedge every position, need not hedge fully, and public open interest does not say who owns which side, so treat the sign as a tendency rather than a mechanism that must fire.
| Positive gamma | Negative gamma | |
|---|---|---|
| Dealer book | Long gamma | Short gamma |
| Hedge as price rises | Sell the underlying | Buy the underlying |
| Hedge as price falls | Buy the underlying | Sell the underlying |
| Effect on the tape | Mean-reverting · flow leans against the move | Pro-cyclical · flow pushes the move along |
| Intraday range | Compressed; realised volatility tends to sit under implied | Wider; gaps and trend days become more likely |
| Behaviour near big strikes | Pinning · price is drawn to and held near large open interest | Acceleration · strikes give way rather than hold |
| What a shock does | Gets absorbed | Gets multiplied by the hedging that follows it |
Why the asymmetry matters. Nothing about GEX says the market will fall. What the model says is narrower: if dealers are short gamma and price starts moving, their hedging arrives on the same side as the move rather than against it, so the flow adds to the move instead of absorbing it. Whether that dominates a given session depends on inventory, hedge ratios, liquidity and every other flow in the book.
The three lines
Flip point, call wall, put wall
The gamma flip, or the zero-gamma level, is the price where aggregate dealer gamma crosses from positive to negative. Under the model, hedging above it leans countercyclical and below it leans procyclical. It is the one level on the chart that marks a change in the character of the tape rather than a change in price, and it moves as open interest changes.
The call wall is the strike above spot with the heaviest call gamma. While dealers are long gamma there, rallies into it meet selling from hedges being trimmed, so it tends to cap. The put wall is its mirror below spot: the heaviest put gamma, where hedging tends to support. Neither is a law. Both are concentrations of obligation that dissolve the moment the open interest behind them expires or rolls.
Max pain, shown alongside them, is the strike at which the aggregate value of open options at expiry is smallest. It is a much weaker signal than the walls, an artefact of the open interest distribution rather than a hedging obligation, and it is worth watching mainly as expiry approaches, when the gamma concentrated around it is largest.
The clock
0DTE: a gamma profile that decays through the session
An option expiring today has enormous gamma within a couple of points of spot and effectively none outside that band, and that concentration sharpens as the close approaches. Same-day expiries therefore do two things that longer-dated open interest does not: they can dominate the near-the-money profile in the afternoon, and they can move the flip point during the session while nothing else about positioning has changed.
The practical consequence: a single net GEX number read at the open is stale by lunchtime. A 0DTE-heavy profile has to be read with its expiry breakdown, which is why Gambit stacks the strike profile by expiry rather than collapsing it into one bar, and why the desk offers 7-day, 30-day and 90-day horizons instead of a single window.
The desk
What Gambit shows, per ticker, on one key
GEX lives on the g key in Gambit Terminal, alongside the option prints tape. Pick any ticker, or any name already on your watchlist, and the desk resolves the whole picture at once: net GEX in dollars, the regime it implies, the gamma flip level, the call and put walls, max pain, 30-day implied volatility, the contract count behind the estimate, and spot. Then comes the strike profile beneath, stacked by expiry, with spot and the flip drawn on it, and a curve of net GEX against price ±15% so you can see how the regime changes if the market moves.
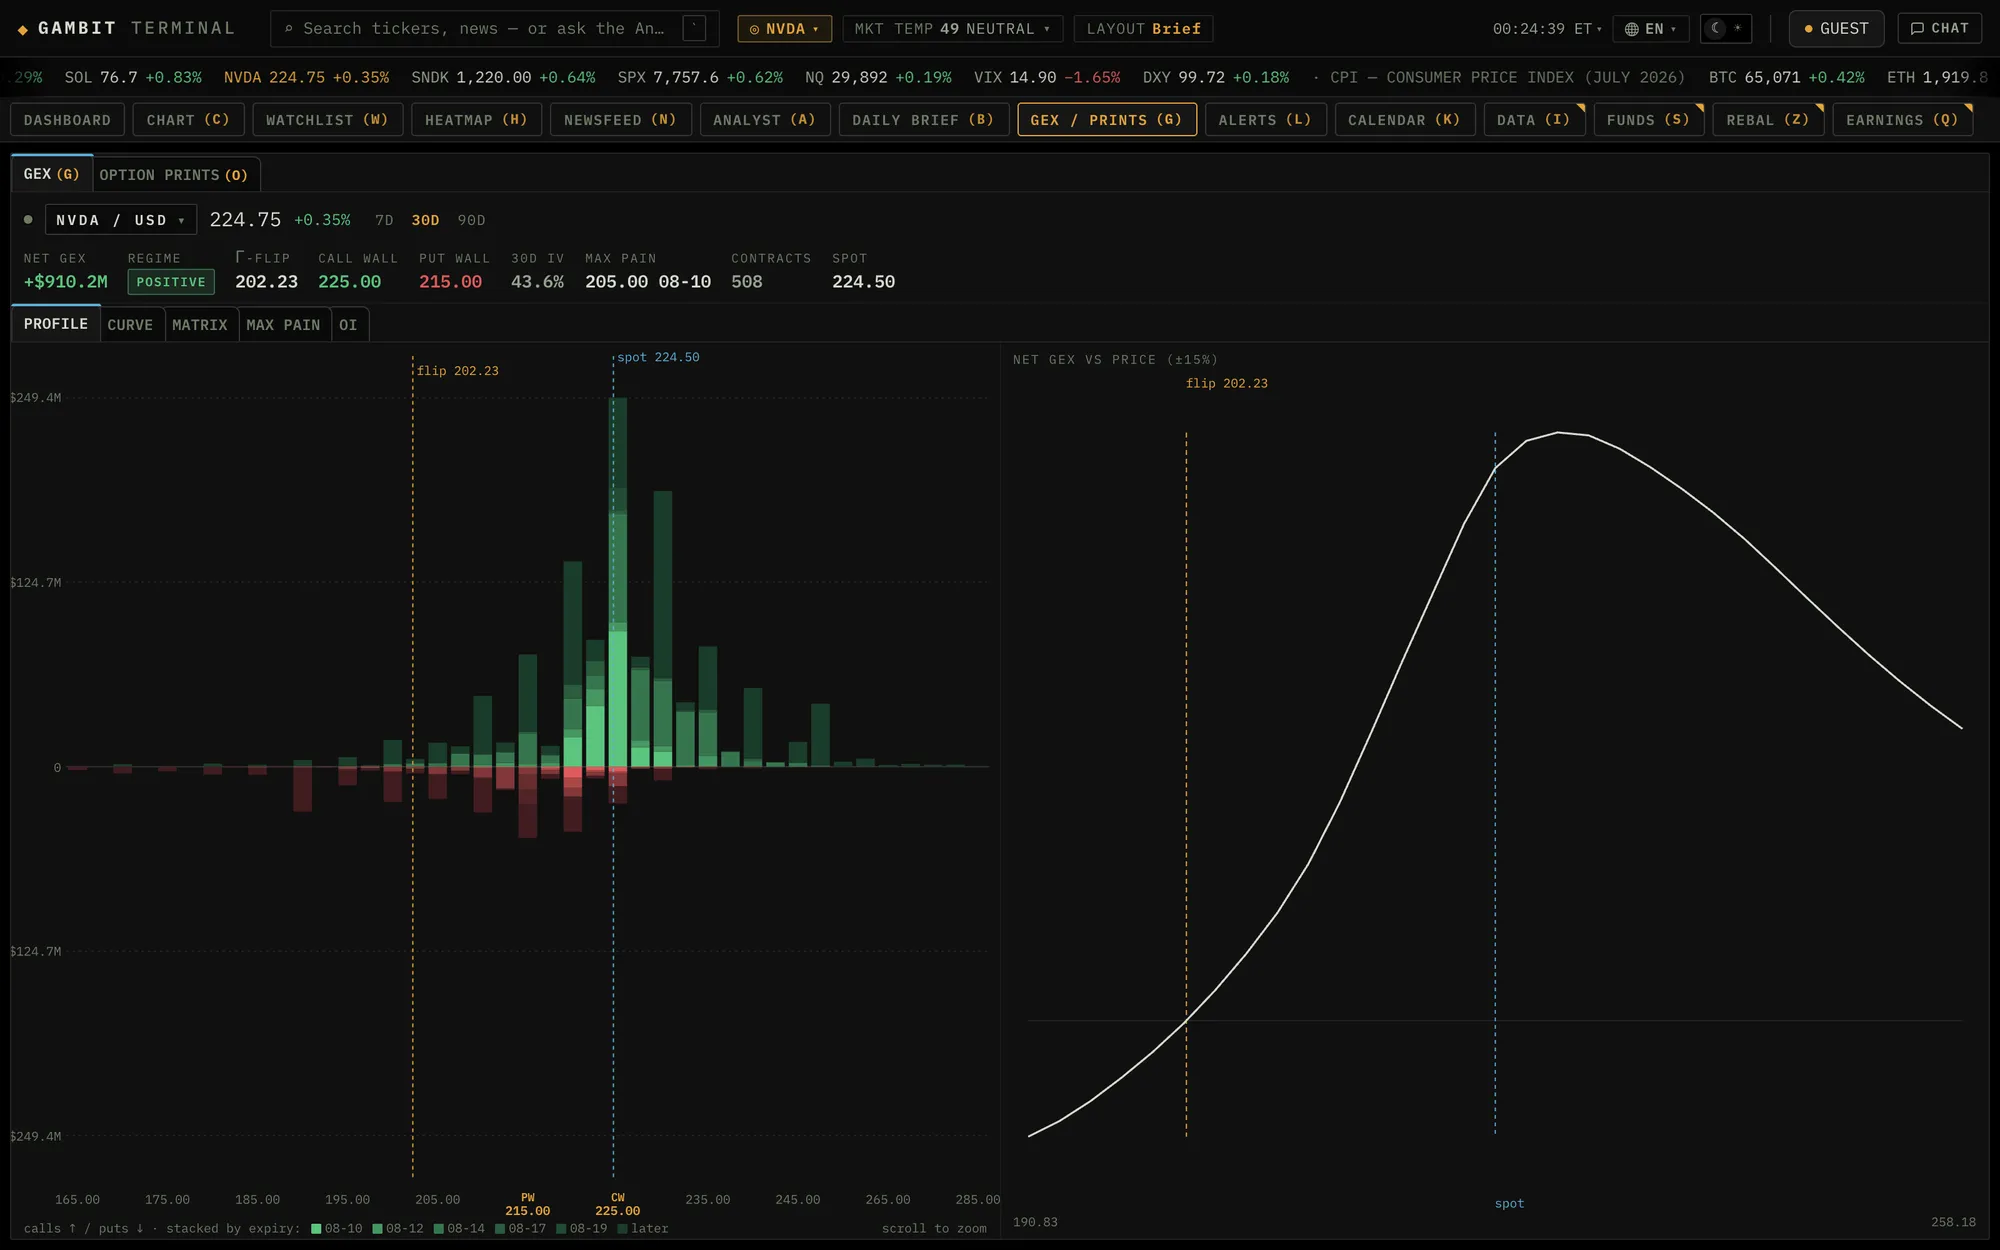
Read that capture the way the Gambit GEX desk intends. NVDA is trading at 224.50 with the flip at 202.23, so the tape is a long way inside the positive-gamma regime: hedging flow is leaning against moves, and the strike profile is dominated by green call gamma stacked just above spot. The call wall at 225.00 sits directly overhead, the strike a rally would have to chew through, and the put wall at 215.00 is the first shelf beneath. The net GEX curve on the right shows the whole shape: comfortably positive here, rolling over toward zero only if price falls back toward the flip. Every one of those numbers is a snapshot from 10 August 2026, held here as an illustration; the live values are one keystroke away in the terminal.
Beside GEX sits OPTION PRINTS, the trade tape itself: the blocks and sweeps that create tomorrow's open interest, and therefore tomorrow's gamma profile. The two desks answer different halves of the same question: where the hedging is, and what is being added to it right now.
Honesty
What GEX is not
GEX is not a position report. No one outside a dealer knows the dealer's book. Every GEX figure published anywhere rests on a convention about which side of each contract dealers hold. It is a model, and it is stated as one.
GEX is not a price target. A call wall is not a ceiling that has to hold; a flip point is not a level that has to break. They are concentrations of hedging obligation, and obligations get repositioned.
GEX is not the whole flow. Index hedging, vanna and charm effects, and single-stock flow that never touches the listed market all move the tape without appearing in an open-interest snapshot.
GEX goes stale. Open interest updates once a day; 0DTE gamma changes hour by hour. What makes GEX useful is reading it as a live, decaying surface, not as a number to write down in the morning.
Questions
What is dealer gamma exposure (GEX)?
A modelled estimate of how much hedging the dealer complex would have to do as the underlying moves. Dealers take the other side of customer option trades and hedge the resulting delta; gamma is the rate at which that delta changes as price moves. Aggregating gamma across every strike and expiry, signed by the side dealers are assumed to hold, gives one number. Gambit reports it as signed dollar gamma per 1% move in the underlying, with a positive figure meaning dealers are modelled as long gamma.
What does positive gamma mean for the market?
Dealers are long gamma, so hedging runs against the move: sell into strength, buy into weakness. That flow is mean-reverting. Ranges compress, realised volatility tends to sit below implied, and price often pins near large strikes into expiry.
What does negative gamma mean for the market?
Dealers are short gamma, so hedging runs with the move: buy as price rises, sell as it falls. Ranges widen, trends extend intraday, and declines can accelerate because hedging supply arrives while the tape is already falling.
What is the gamma flip point?
The price at which aggregate dealer gamma crosses zero. Above it the market is in the positive-gamma regime and hedging dampens moves; below it hedging amplifies them. It marks where the behaviour of the tape is expected to change character.
What are the call wall and the put wall?
The call wall is the strike above spot with the largest call gamma concentration; the put wall is the strike below spot with the largest put gamma concentration. While dealers are long gamma, hedging around them tends to resist moves through them, until that open interest expires or is repositioned.
Why do 0DTE options matter for gamma?
An option expiring today carries enormous gamma within a few points of spot and almost none away from it, and that concentration decays hour by hour. Same-day expiries can dominate the near-the-money profile in the afternoon and move the flip point during the session, then vanish overnight.
Is GEX a positioning report?
No. It is built from public open interest plus a convention about which side dealers hold. Read it as a map of where hedging pressure is likely to concentrate, not as a disclosure of anyone's position.
Keep going
Around the flow
Gamma tells you how the tape behaves; the rest of the desks tell you what is priced into the names you follow.